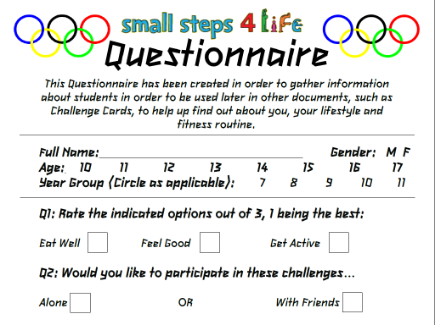
| Questionnaire Amongst the many publications that were required during the project, the questionnaire was one of the most prominent. The questionnaire would be handed out to students to collect information regarding their general lifestyle, dietary routine and portion sizes. It also gave useful information on activities and exercise regimes they took part in, or just generally what they did to relax and feel good. Once the questionnaires had been filled in, I would be able to find out what challenge people take part in and what challenges would be a positive to their lives. The questionnaire had to be suitable for purpose and audience, the audience being the students involved, so naturally it had to be relatively interesting and not entirely dull. The publication was created in Microsoft Publisher, with an A4 blank page and added a title, before going on to type up my pre-written questions I had prepared. I added colour in areas including either side of the title by adding images of the Olympic rings, and adding cartoon pictures of a thumbs up hand gesture at the end of the questionnaire – the student would see this right as they finished the questionnaire. To keep with the Olympic theme throughout the document the London 2012 Olympic font has been used throughout. I had designed the questions with the audience in mind, with none of the questions being that difficult. A lot of the questions were multiple choice which appeals to the audience as, typically, teenagers aren’t particularly eager to be writing long answers – they want questionnaires to be concise, quick and succinct. Multiple choice questions enables this. A problem I encountered subsequent to creating the document was that I had missed out a rather important question – the question would’ve given me information into the most popular and least popular food groups that people liked and this information would’ve been used in the Questionnaire Results spread-sheet, in the database queries and reports, and also would’ve been the primary focus of the Meal Cards. If this was a real-world situation, I would have to redo, or at least edit, the document to compensate for this. I would also be more thorough with checking my documents to ensure this kind of mistake could be identified and rectified before it being too late, by continuing through the project without amending the issue. In this particular case however, I have added the missing question to the questionnaire, and for any publications or documents/files that would’ve required the information the question would’ve given, I have used one person’s results (Daniel Lowton’s – the student that sits next to me). These results can be found attached to the left, under the filename “Dan’s Results.pdf”. If I were to do this publication again, I would spend more time thoroughly completing the work and also systematically checking the publication before moving on. |

.png.opt433x324o0,0s433x324.png)
| Spreadsheet - Data View To contain whatever
data I had collected from my questionnaire publications, a spread-sheet had to
be created – enabling an organised, and informative view on all the data. All
the data was input into the spread-sheet, with recipients’ names across the
left side and pie charts and graphs underneath the raw data. This spread-sheet was
intended to inform me of my audience’s preferences so that my publications
would be suitable for audience. If I were to complete this spread-sheet again,
I would spend more time improving the aesthetics and perfecting the
graphs/charts. |

.png.opt435x325o0,0s435x325.png)
| Spreadsheet - Formula View See above description. This Formula View enables the viewer to easily the what's behind the front-end, displaying the formula behind the data and graphs/charts. |